
Graph engineering is the skill of drawing an AI workflow into a diagram of nodes (each node is a task) and arrows (which task has to wait for which), so that tasks that don't depend on each other run at the same time. Instead of lining up steps in a row, you split them into multiple parallel branches and then merge the results. The workflow runs faster, has fewer failure points, and has a place to put independent check steps for each result.
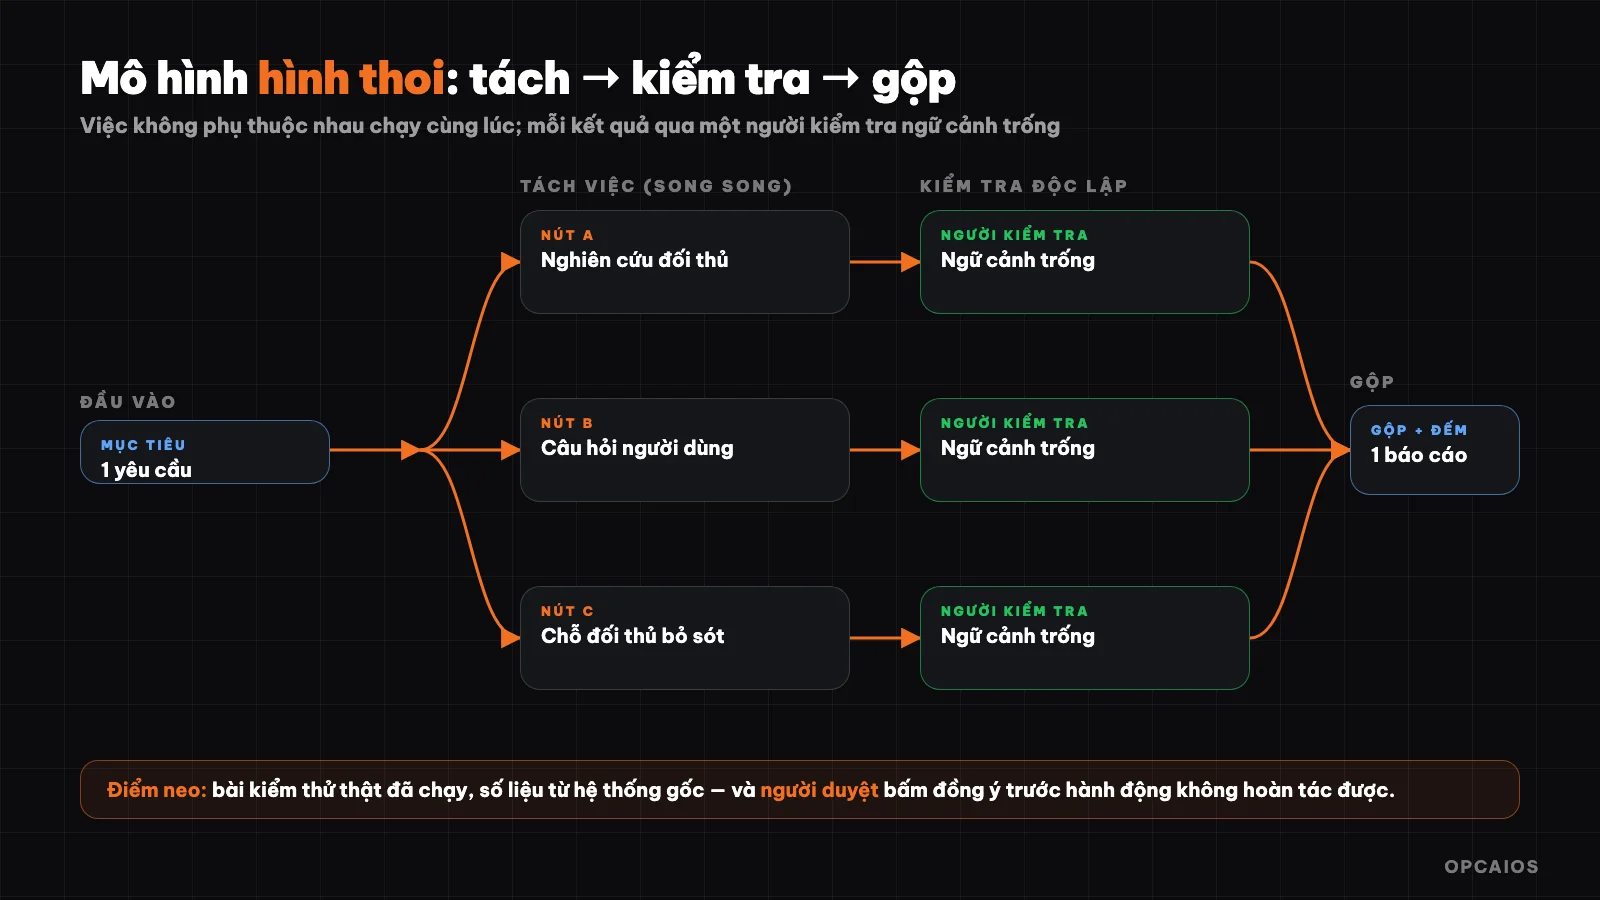
The "diamond" model in graph engineering: split tasks, run in parallel, check with a different AI, merge back. Diagram: OPCAIOS.
This post is based on ideas from "Graph Engineering explained: what it is, when to use it and when not to" by Anatoli Kopadze (@AnatoliKopadze) on X (24/7/2026). OPCAIOS rewrote it with its own approach, added Vietnam examples and real-world experience. The numbers about speed and cost come from the original author; OPCAIOS has not verified them independently.
What is graph engineering?
Graph engineering is designing an AI workflow as a graph: a plan drawn out so you can see two things, what tasks need to be done and which task has to wait for which. The concept has only two parts.
- Node: a single task done by an AI agent, with one input and one output. Example: research a competitor's price, write a draft, check a claim.
- Edge: an arrow connecting two nodes, meaning the next task needs the result of the previous one so it has to wait. The arrow only means something when real data flows through it.
For a node to be used in the graph, the node needs a "contract": a task with clear boundaries, defined input and fixed output format. A node that returns free-form text only the reader can understand; a node that returns a fixed format, like price, package, source, date, then the next node can read straight from it without guessing. The idea is not new: workflow management systems have used dependency diagrams for many decades, and what's new is only applying it to AI agents. According to Anatoli Kopadze's post on X (24/7/2026), a linear 40-step workflow might have only 3 to 5 real dependencies when redrawn; this number is the author's illustrative estimate, OPCAIOS has not verified it. For example, 3 nodes researching competitors can run at the same time then feed into 1 draft.
What is a false edge and how do you find it?
A false edge is an arrow in the workflow but no data flows through it, so waiting there just wastes time. The test is only one question, at each step: does this step really need the result of the step right before it? If yes, keep the order. If no, the two tasks can run at the same time.
Example: a request to "check file A for errors, then check file B for errors" reads like a sequence, but checking file B does not use the result of file A at all. The two tasks run one after the other only because the person who wrote it typed them in that order. Run them in parallel, the total time equals the time of whichever file is slower, not the sum of both files.
Almost every workflow has two or three false edges. The original author estimates a linear 40-step workflow might shrink to only 3–5 real dependencies when redrawn, meaning from several minutes down to several seconds with the same amount of work. This is the author's illustrative estimate, not a measurement; the actual speed depends on each workflow. The takeaway still holds: the bottleneck is usually how you line things up, not the AI model.
The Diamond Model: Split, Check, Merge
The diamond model is the most common design pattern in graph engineering, consisting of three stages: splitting work into many parallel branches (fan out), merging and reducing results with ordinary code (reduce), then having a final agent write an answer from the merged section. Between stages one and two, there is usually an additional verification step. Anatoli Kopadze's original post on X (24/7/2026) presented this model.
The diamond appears in nearly every serious agent system. The deep research feature in many AI assistants runs exactly by this pattern: one agent plans the research angles, multiple sub-agents gather in parallel, results are verified, then a single report reaches the user. Hypothetical example: 1 agent splits a topic into 3 research angles, 3 sub-agents gather in 10 minutes instead of 30 sequential minutes, one agent verifies then one agent writes the report. Once you see this pattern, the question shifts from "how to make the agent do more steps" to "where to split, where to merge", and the second question opens up possibilities.
Two design tips come with it: use a cheap model for dull nodes (gathering, extraction), use a strong model at nodes requiring judgment (verification, synthesis); and let the merge part run in code, since code doesn't cost tokens. For how to choose models by task, see Which AI model should I choose?.
Why must the verifier have its own context?
The verifier must be a separate agent, starting from empty context, because AI grading itself is usually too lenient with itself. According to the original author Anatoli Kopadze (X, 24/7/2026), AI's self-evaluation tests show the model misses most of its own errors; OPCAIOS has not independently verified this claim. Hypothetical example: Claude writes some code then grades itself 10 out of 10, while another Claude starting from empty context finds 2 bugs.
A verifier using the same conversation with the worker is no longer real verification. A graph where all agents share one context is a single-loop masquerading as a graph: broken the old way, just slower and more expensive.
Principles for the verification node:
- Input is only a claim needing verification, not accompanied by the worker's conversation history.
- Fresh, empty context, never seen the work being graded before.
- Verify by real signals: not "agent said it's done" but "the test actually ran through".
- Divide three angles: is it correct, is it complete, are sources real. Three different angles catch what ten identical angles miss.
Where does a graph usually break?
A graph usually breaks in three places: context overflow, false independence, and silent dead nodes, each with a specific fix. For example, a 200-node graph dumping all 200 raw results straight into 1 final step will exceed Claude's or ChatGPT's context limit before synthesis even starts.
Context overflow. Spawning thousands of nodes then pouring all results into one final step exceeds the context limit before synthesis begins. Fix: merge in layers, divide results into batches, summarize each batch then merge the summaries, never merge raw data piles.
False independence. Two nodes look independent because their instructions don't mention each other, but both write to the same file or call an API with rate limits. That's a hidden edge. Fix: give each agent its own workspace, for instance each agent its own git worktree, and check shared resources not just shared data.
Silent dead nodes. In a sequence, one failed step stops the whole chain, painful but visible. In a graph, one dead node among two hundred might slip into a report that looks complete. Fix: each merge step counts received results against expected, and warns when short instead of running with half the data.
When should you not use a graph?
A graph buys breadth, it doesn't buy better judgment. For example, fixing 1 bug in 1 file takes 5 minutes with one agent, but building a graph just adds orchestration cost. When work isn't wide, a straight line was never the problem. Skip the graph in these cases:
- Small or isolated work, like adding a function or fixing a bug: orchestration only adds cost, one agent does it faster and cheaper.
- You want to review each step: graphs are built to run wide while you're away, tight control goes against that purpose.
- You don't yet know what you're looking for: exploration fits with one agent you steer better than a team locked into a plan.
- Steps truly depend on each other: forcing a graph onto sequential work just costs more without getting faster.
A quick way to tell is the false edge test: if you can't find two tasks with no arrow between them, there's no graph to build, and a loop is enough.
Cost and "anchors": graphs are only honest when there's something indisputable
Graphs cost more than a typical conversation, because orchestration is cheap but agents still use tokens, and a team of agents uses a lot. According to Anatoli Kopadze (X, 24/7/2026), a public example used this approach to rewrite a large software runtime in about 11 days with up to 64 agents running simultaneously, costing around $165,000 in usage and requiring continuous designer and oversight; this figure has not been verified by OPCAIOS. The lesson doesn't lie in the number but in two things: set hard limits on the number of agents in the first run, and monitor costs before scaling.
More importantly is the anchor. A graph made up of checking nodes that look at each other and read each other's reports can still be "consistent but unverified": an audit matching data against financial data, when both come from one system. Graph structure doesn't buy you truth by itself. You need indisputable anchors: test runs that actually happened and passed, real revenue hitting the bank, real customers who stayed. A graph is only honest when measured by things you can't negotiate.
Is the Automatic SEO Post Process of opcaios.org a graph?
Yes, the Automatic SEO Post Process of opcaios.org is a small, entirely sequential graph. This is our actual experience, not a hypothetical example, and it runs once a day on the OPCAIOS website. The automatic daily SEO post on the website runs: choose a topic, write an outline, write the post, score SEO and GEO (rewrite once if the score is low), then one dedicated AI call that only reads the finished post and lists claims that need human verification, like data, prices, dates.
Two points of this process match the lesson above. The step that lists claims is a checker with its own context: that AI didn't see the writing process, only reads the result. And there's a human review gate: every post is only in draft form, the reviewer clicks approve and it goes live; AI doesn't post by itself. This process is sequential because each step needs the result of the previous step, true to the spirit of adjacent falsification: there's nothing worth splitting in parallel, so there's no need to force it into a wide graph.
How do you write a "graph specification" in Vietnamese?
A graph specification is a request sent to Claude Code or a similar tool, describing the goal, the parallel work, merge steps, check steps, where to save, and the review gate, so agents build the right process. For example, for creating a draft SEO post, the reviewer is still the final step. A hypothetical example: 3 parallel tasks, 1 merge step, 1 checker, and 1 review gate, running with a limit of 3 agents on the first run:
GOAL: a draft post ready to rank for the topic [topic]

PARALLEL TASKS:
  1. what pages ranking high currently cover
  2. what real questions users usually ask about the topic
  3. what those pages are missing
MERGE:      three results into one outline, then write a complete draft
CHECK:      one independent verifier, blank context, mark every claim
            without a source
SAVE:       drafts/ directory, record the marked claims list at the top of the file
REVIEW GATE: never auto-post anything
According to the original author, with Claude Code you can start a request with the word "workflow" so the tool builds a whole agent team from one sentence; this feature changes with tool versions, so check the current Claude Code documentation. Whatever tool you use, the principle stays the same. First, the first run limits small (for example 20 files), give each agent its own space, report the count of results you get back, and keep yourself as the final reviewer.
Where do you start on an evening?
The cheapest way to start needs no new tool, just paper and pen:
- Draw the AI process you're using as boxes connected by arrows.
- At each arrow, ask: does the next step really use the result of the previous step? Delete arrows that don't carry data.
- Group boxes with no dependencies into a layer running in parallel, then add a merge step.
- Put one checker with separate context before the merge step, and one real anchor (a test run, data from the original system).
- Test run on a small part, record the cost, then scale.
If you build the process using a tool like n8n or a script calling API, the same principle applies: run independent branches at the same time, count results at the merge step, and keep a review gate before irreversible action.
Frequently Asked Questions
How is graph engineering different from loops?
A loop is an agent improving something repeatedly: try, check, adjust, redo. Graph engineering connects many loops and many tasks into a network, where nodes check and fix for each other instead of one agent scoring itself.
Do you need to know programming to do graph engineering?
Not required to understand and design, since the step of drawing diagrams and asking "is there really a dependency" only needs paper and pen. To run it for real, you use ready-made tools like Claude Code, n8n, or Make; writing code is only needed when you want detailed control.
Is an agent graph always faster than a sequential process?
No. A graph is faster when work has many independent parts. If steps truly depend on each other or the work is small, a graph only adds coordination overhead without being faster.
How do you avoid a graph costing money unintentionally?
Set hard limits on agent count and file count per run at first, track the cost of one run before scaling up, and use cheap models for dull nodes. The merge step should run as code instead of AI.
Where should you start learning?
Start with a fake edge test on a process you're already using. If you want to build an AI process for a small team, check out OPCAIOS's AI application training course.
Source: ideas and figures from @AnatoliKopadze's post on X (24/7/2026), not independently verified; the Auto SEO Post example is OPCAIOS's experience.
Translated from Vietnamese with AI. Read the original.
Want to apply this in your business?
Book a free 30-minute call (Vietnam time, in English or Vietnamese).